Global Market Snapshot 17th September 2024
-
 By FXT
 - September 17, 2024
- FXT Analysis
The US Dollar Index is gradually declining, trading at 100.6978 during the session, down by 0.42%. USD/JPY has fallen below the key level of 140.70, with the momentum oscillator continuing to indicate downward pressure. EUR/USD has risen for the third consecutive day, benefiting from speculation about the extent of the Federal Reserve’s rate cut on Wednesday, which has weakened the dollar.
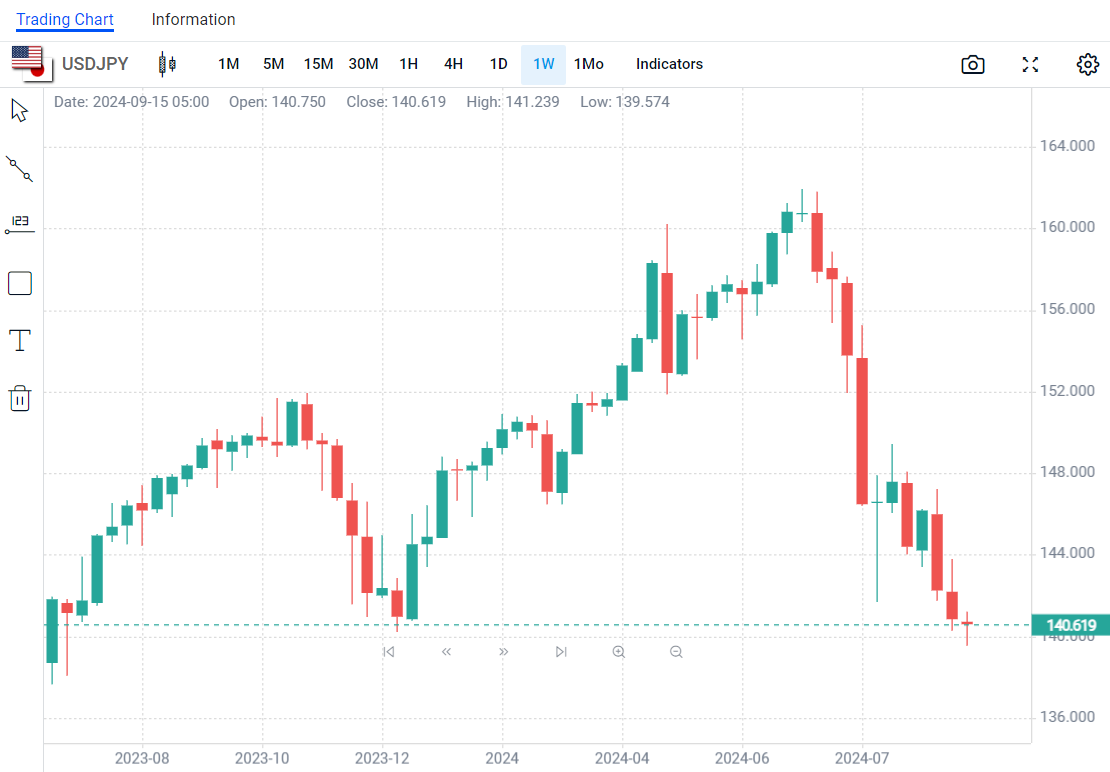
USD/JPY Hits a 14-Month Low
USDJPY has dropped sharply, hitting a 14-month low of 139.56, continuing to face heavy selling pressure. Since mid-August, USD/JPY has been in a bearish trend, with technical oscillators confirming the current movement. Further downward pressure could push the pair towards the July 2023 low of 137.25, followed by the psychological level of 133.00 set in April 2023.
On the other hand, if it breaks above the resistance zone of 140.25 – 140.70, it may open the way toward the 20-day simple moving average at 141.45. A slight uptick with a short-term descending trend line at 141.70 could halt further upward movement. In summary, USD/JPY has shifted to a bearish outlook in the medium to short-term time frames, especially after breaking below the 140.70 support level.
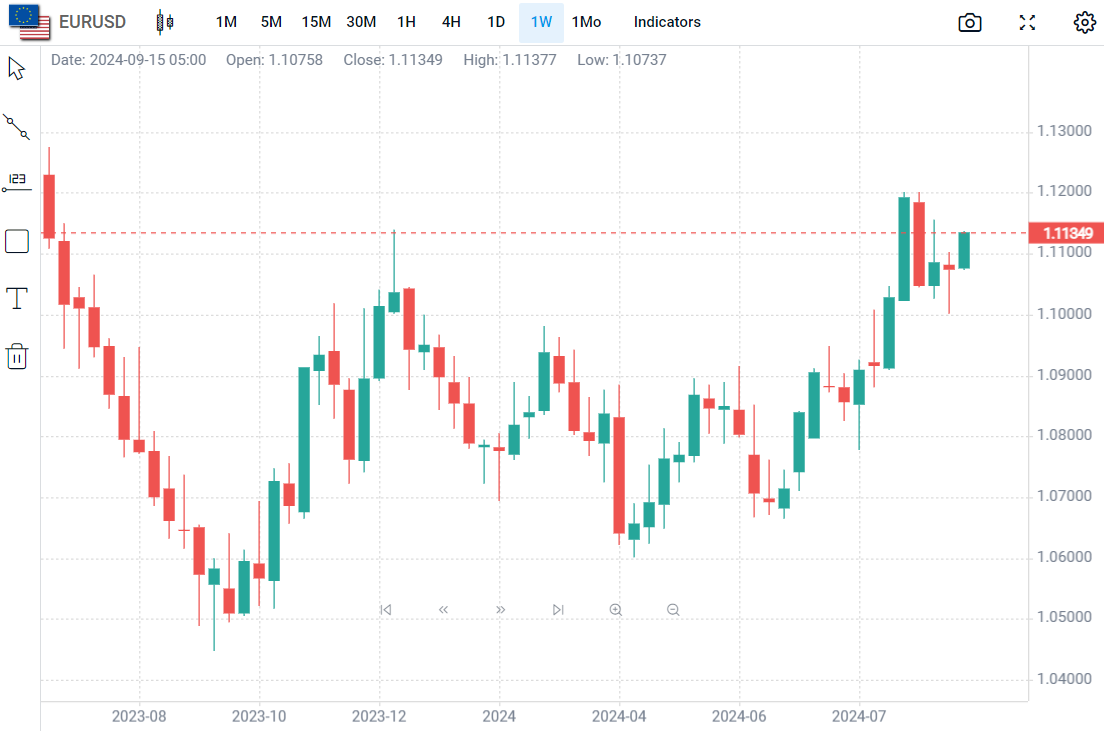
EUR/USD Outlook: Euro Rises Further as the Dollar Weakens
EURUSD has risen for the third consecutive day, driven by speculation about the Federal Reserve’s potential rate cut, which has led to a weaker dollar. The pair’s upward trend started from a higher low, following a double rejection above the 1.10 psychological support. It has now retraced to 61.8% of the previous pullback (1.1201 – 1.1002), increasing the likelihood of further gains.
Technical indicators support a bullish outlook, with moving averages aligning positively and the RSI continuing its upward movement above the neutral zone. However, the 14-day momentum indicator remains in the negative zone, signalling a possible risk of stalling. A daily close above the Fibonacci 61.8% level (1.1125) is needed to trigger new bullish signals, while a drop below this level and the 20-day moving average (1.1092) could weaken the recent structure.
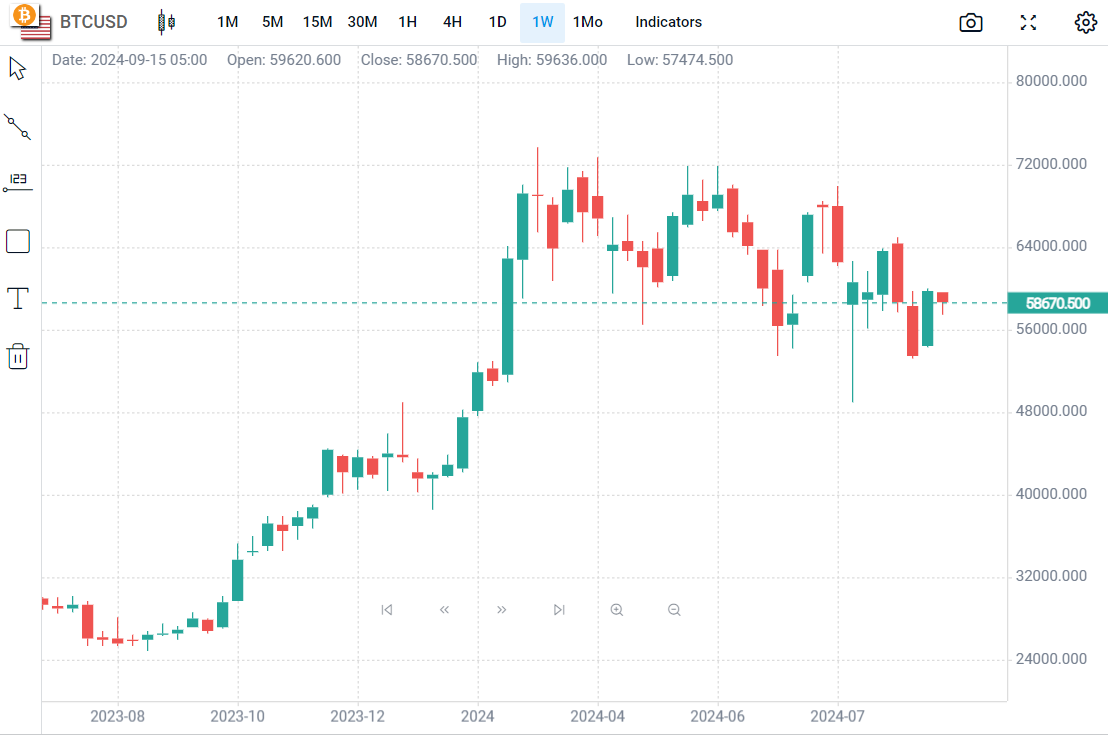
BTC, Bitcoin regained its upward momentum, rebounding by more than 4% to reach $60,540, moving back above its 20-day and 50-day moving averages. However, it failed to hold the key level of $60,000, subsequently dropping 2% to $57,930
Related Posts

The 5 Best Indicators for Predicting Forex Price
- By FXT
- August 31, 2023

Two Essential Forex Concepts for Novice Traders
- By FXT
- November 3, 2022

Global Market Snapshot 20th May 2024
- By FXT
- May 20, 2024


